16 CSS Infographics
A CSS infographic is a visual representation of information or data, such as a chart or a diagram, created and styled primarily with HTML and CSS. This approach allows you to build engaging, web-native infographics that are responsive and interactive without relying on static image files. Unlike a static image, CSS infographics are fully responsive and scalable, adapting to any screen size, and are also lightweight and accessible as the text content is indexable by search engines. Common techniques include creating bar charts using div elements where the height represents the data value, and crafting pie charts with the conic-gradient CSS function. This collection showcases a variety of data visualizations built with just HTML and CSS, providing examples to help you learn how to represent data in a visually compelling and web-friendly format.
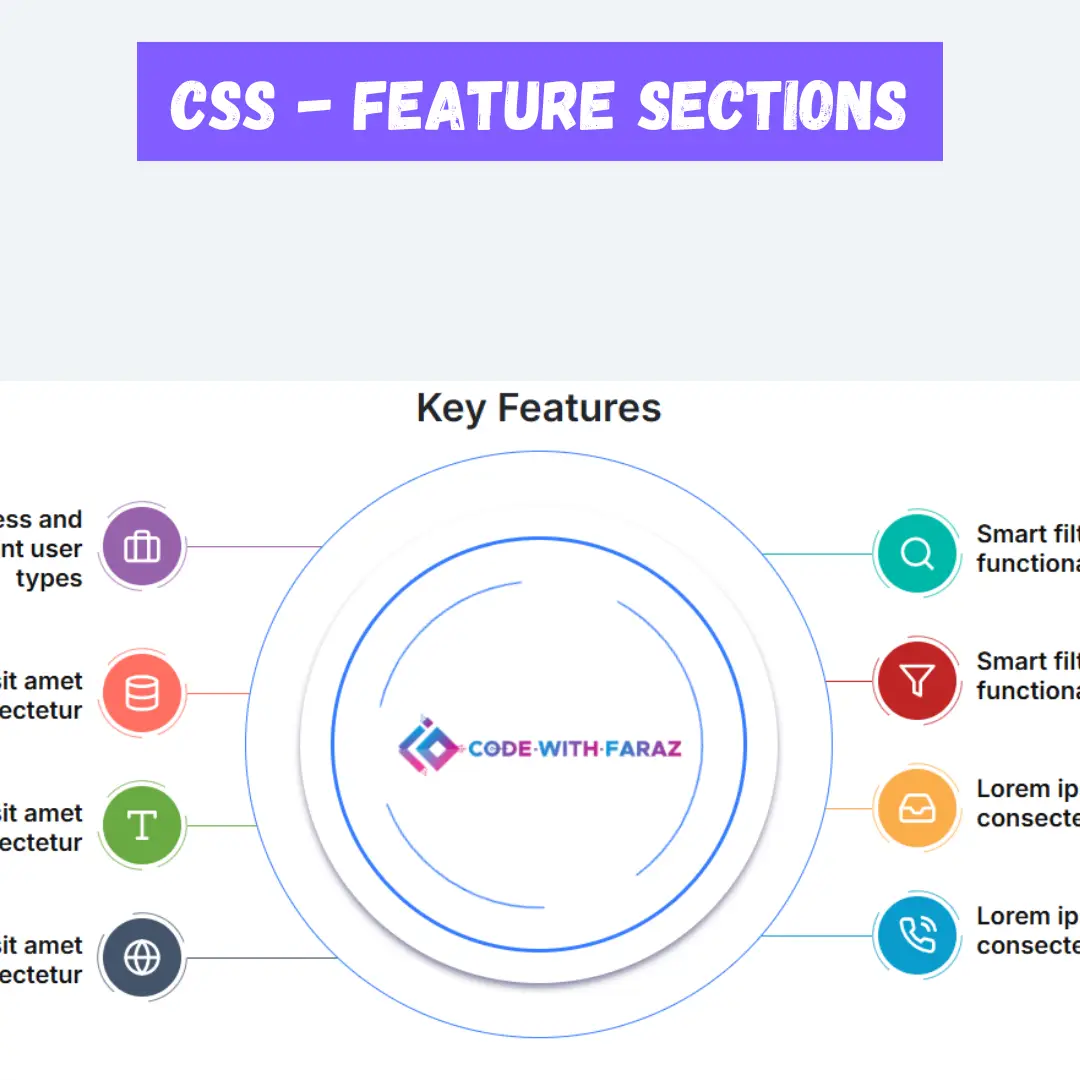
Feature Infographic Section with Animated Icons
A visually rich feature infographic section built with HTML and CSS that highlights key product or service features through an elegant dual-column layout. The center column features a rotating circular graphic with a logo, while feature cards on both sides are connected with arrow lines and decorative circle borders. Each feature includes a colorful icon, tooltip, and title for better visual storytelling.

Infographic with Odd-Even Variable Switching
A vibrant, step-by-step infographic built entirely with CSS, where a single variable switches the styling between odd and even items. Each card features gradient backgrounds, emoji icons, and dynamic numbered counters, all arranged in a responsive grid that adapts gracefully to different screen sizes.

Rotating Circular Step Infographic
A vibrant, circular step-by-step infographic created entirely with CSS. Each step is represented as a colored circular card arranged in a 3D ring, with rotation and translation effects giving a dynamic, layered look. Pseudo-elements add borders and depth, while gradients and subtle shadows enhance the visual hierarchy.

3D Gradient Infographic Card Stack
A visually engaging infographic built with pure CSS, featuring a stack of gradient cards with icons, titles, and descriptive text. Each card is positioned in 3D space with subtle rotation, offsets, and shadow effects to create depth and hierarchy. CSS counters automatically number the cards, while responsive styles ensure the layout adapts to different screen sizes.

Gradient Step Timeline Infographic
The Gradient Step Timeline Infographic is a visually striking infographic layout that combines bold gradient bars, step counters, and emojis to illustrate progress or stages creatively. Each section represents a unique step with a vibrant gradient background, an expressive emoji icon, and a short descriptive paragraph.

Gradient Emoji Progress Bars
Gradient Emoji Progress Bars showcase a creative way to display information using vibrant gradient backgrounds combined with emoji icons. Each bar visually represents a data point or message with layered color effects, subtle shadows, and rounded shapes, making the content both engaging and easy to interpret. The design is fully responsive, ensuring the bars adapt smoothly to different screen sizes, perfect for infographics, interactive dashboards, or visually appealing blog content.

Gradient Emoji Infographic Cards
Create a vibrant and visually engaging collection of infographic cards featuring emoji icons, gradient backgrounds, and numbered options. Each card presents a title, description, and themed icon with layered linear and radial gradients, subtle 3D effects, and soft shadows for depth. The responsive grid layout ensures the infographics adapt seamlessly to different screen sizes while keeping information clear and easy to scan, making it ideal for showcasing product features, data summaries, or creative visual storytelling in a stylish and modern design.
Gradient Infographic Cards with Emoji Icons
This is a colorful infographic layout designed to display information in a visually engaging way. Each card represents a separate data point with a title, description, and an emoji icon for quick recognition. The background of each card uses smooth HSL-based gradients, giving a modern and vibrant look. Circular clipping, radial highlights, and subtle shading create depth, while the layout is fully responsive, adapting elegantly to different screen sizes. This infographic style makes complex information easy to scan, attractive, and memorable for viewers.
Colorful Timeline Infographic with Icons
A dynamic timeline section where each event is represented by a card featuring a title, descriptive text, and a unique emoji icon. Each card is enhanced with vibrant gradient backgrounds, smooth transitions, and 3D-like layered effects. Curved connecting lines with conic gradients visually link the events, creating an engaging, modern layout that highlights milestones or key moments in an interactive and visually appealing way.

Gradient Card Infographic Section
A vibrant infographic section with gradient-colored cards, each showcasing a title, descriptive text, and a numbered circular marker. The design uses layered gradients, subtle shadows, and responsive layouts to create depth and visual interest, making each card stand out while maintaining a clean and modern look.

Circular Numbered Paragraph Infographic
A visually striking infographic section where each paragraph is displayed inside a circular, gradient-filled shape with numbered markers. The design features alternating alignment, radial shadows, and smooth background gradients over a fixed image, creating a modern, interactive layout that highlights text in a creative and visually appealing way.

Timeline Infographic with Gradient Bars
A visually engaging timeline infographic featuring gradient-filled bars for each year, with smooth color transitions, subtle 3D effects, and connected content blocks. Each bar highlights the year, title, and description, creating an interactive and stylish way to showcase milestones, events, or key moments in a modern and responsive layout.

Gradient Step Infographic with Skewed Shadow Effects
A visually striking infographic featuring sequential paragraphs with gradient backgrounds and dynamic skewed shadows that create a sense of depth and movement. Each paragraph is numbered and styled with vibrant gradient borders, making the content easy to follow and visually engaging.

Infographic Cards with Decorative Headers
A stylish infographic layout presenting sequential steps with eye-catching cards that combine colorful gradients, shadows, and rounded edges. Each card clearly shows the step number, title, and descriptive text, making complex information visually easy to follow.

Colorful Infographic Cards with Gradient Backgrounds
A creative infographic card layout featuring vibrant gradient backgrounds, icons, and neatly structured text. Each card displays unique color tones and smooth transitions, giving a lively and modern look. Designed using CSS Grid and HSL color values, these infographic cards are perfect for presenting data, product highlights, or visual storytelling in a clean and engaging way.

Infographic UI
A Infographic UI Design is a creative web design component that visualizes data and information in a clean, organized, and easy-to-understand format. Built with HTML and CSS, its purpose is to present complex information in a visually engaging and digestible way. This design is perfect for websites, blogs, or reports that need to communicate statistics, processes, or timelines effectively, as it enhances user understanding and retention.